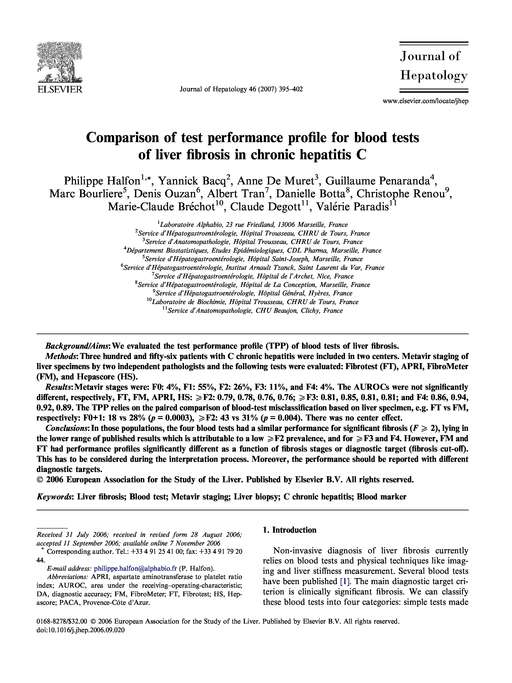
Comparison of test performance profile for blood tests of liver fibrosis in chronic hepatitis C.
Journal of hepatology
Halfon P, Bacq Y, De Muret A, Penaranda G, Bourliere M, Ouzan D, Tran A, Botta D, Renou C, Bréchot MC, Degott C, Paradis V
2007 J. Hepatol. Volume 46 Issue 3
PubMed 17156890 DOI 10.1016/j.jhep.2006.09.020
BACKGROUND/AIMS
We evaluated the test performance profile (TPP) of blood tests of liver fibrosis.
METHODS
Three hundred and fifty-six patients with C chronic hepatitis were included in two centers. Metavir staging of liver specimens by two independent pathologists and the following tests were evaluated: Fibrotest (FT), APRI, FibroMeter (FM), and Hepascore (HS).
RESULTS
Metavir stages were: F0: 4%, F1: 55%, F2: 26%, F3: 11%, and F4: 4%. The AUROCs were not significantly different, respectively, FT, FM, APRI, HS: >or=F2: 0.79, 0.78, 0.76, >or=0.76; F3: 0.81, 0.85, 0.81, 0.81; and F4: 0.86, 0.94, 0.92, 0.89. The TPP relies on the paired comparison of blood-test misclassification based on liver specimen, e.g. FT vs FM, respectively: F0+1: 18 vs 28% (p=0.0003), >or=F2: 43 vs 31% (p=0.004). There was no center effect.
CONCLUSIONS
In those populations, the four blood tests had a similar performance for significant fibrosis (F>or=2), lying in the lower range of published results which is attributable to a low >or=F2 prevalence, and for >or=F3 and F4. However, FM and FT had performance profiles significantly different as a function of fibrosis stages or diagnostic target (fibrosis cut-off). This has to be considered during the interpretation process. Moreover, the performance should be reported with different diagnostic targets.
Citation Reference:

